This article originally appeared on MyAbilities.com
Article Summary: The DOL strength levels classify jobs into 5 separate categories defined by force/weight, and frequency of exertion. The classification system leads to a broad oversimplification of the demands of work, which in the worst case can lead to over and underestimates of physical demands of over 500%. A much more granular system is needed to better understand the different physical demands of work, and how that can be used in return to work, and injury prevention.
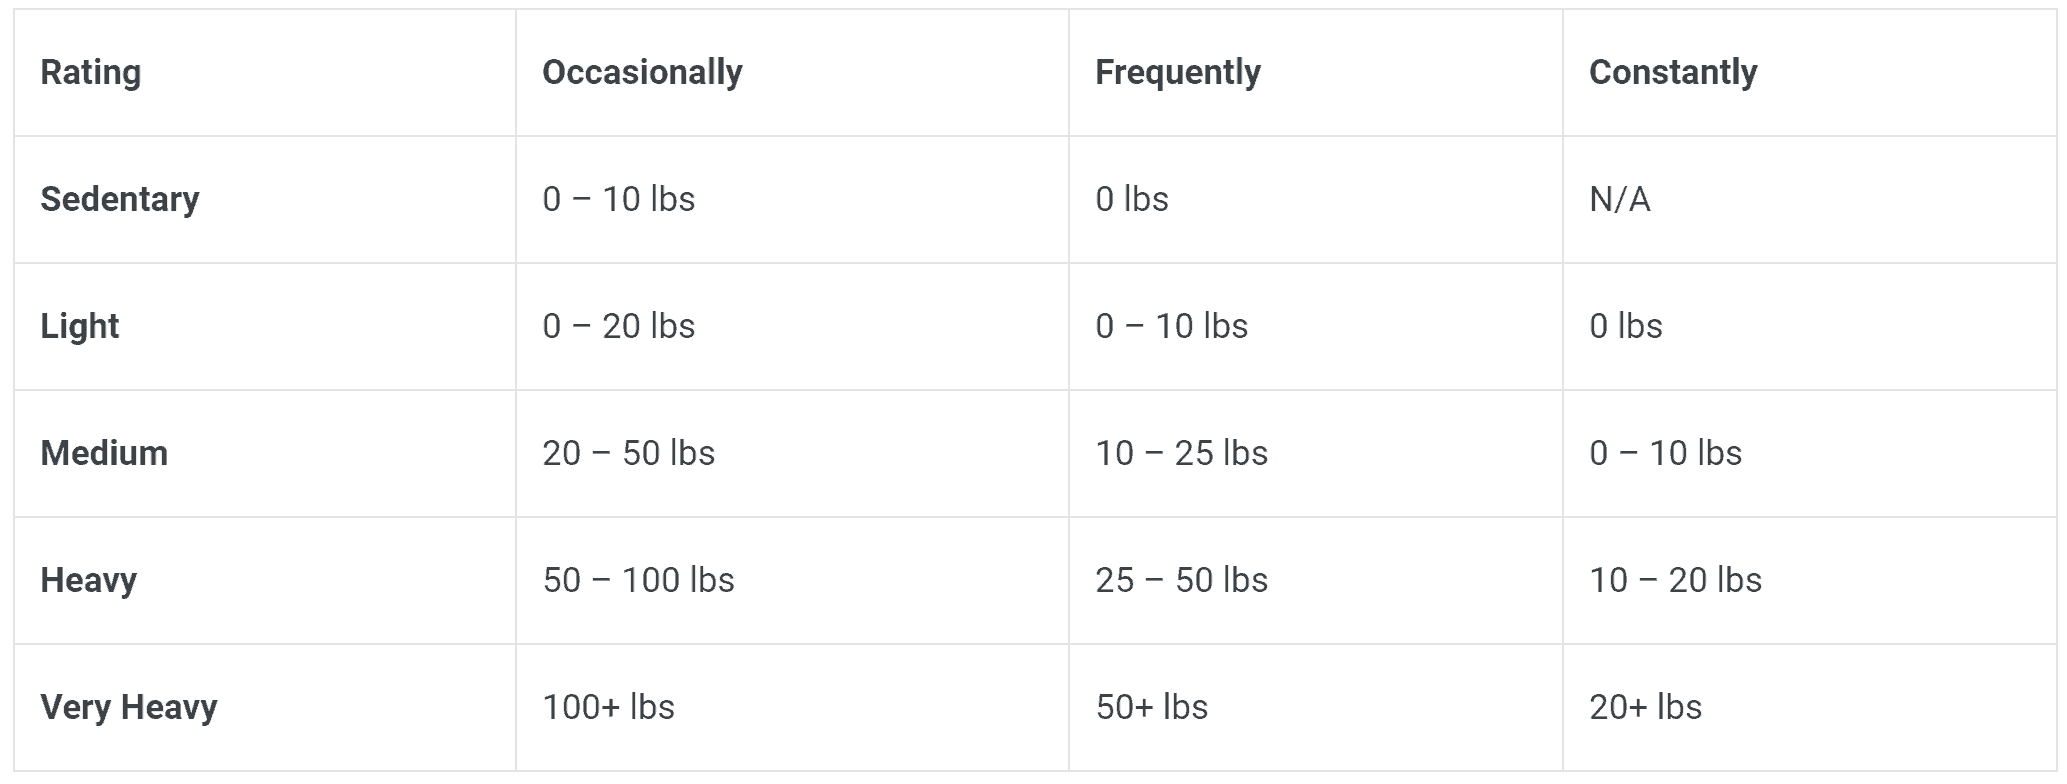
The Department of Labor’s strength definitions are widely used when determining the physical demands of a job, or the capacity of a worker when it comes to post-offer of employment testing, return to work, disability management, and functional capacity evaluations. These strength definitions aim to look at the material handling component of jobs, and state what is required of the worker to be able to successfully perform that aspect of the work. Strength demands of work are broken into 5 categories – sedentary, light, medium, heavy, and very heavy. Each of these demand levels have a force and frequency component – stating what weight a person can lift, push, pull, or carry at a given frequency (Table 1).
Click Link to Access Free PDF Download
“4-Step Sequence For Effective Employee Screening, Hiring, & Placement”

Table 1. Force/Weight, and frequency characteristics for the DOL levels of Sedentary through Very Heavy.
Most Common Jobs in America Are In Medium Category
According to the Bureau of Labor Statistics, the most common jobs in America are in the medium category – but this varies greatly by industry. Management and technical jobs have more of the light jobs, whereas construction, trades, and manufacturing jobs have more of the heavy jobs (Figure 1).
5 Levels of Classification Lack Granularity
While these five levels of classification of strength are useful in providing an initial look at the demands of work, there is not a lot of granularity when it comes to establishing how a worker is capable of performing these tasks.
NIOSH Lifting Equation – Vast Majority of DOL Levels For Strength Would Be Unacceptable
Ergonomists have a wide variety of tools for assessing the demands of work, and many are specific to individual physical demand types. One of these tools is the NIOSH lifting equation (Waters et al., 1991) – a tool that looks at the start and end height of a lift, the frequency and duration of lifting, the twisting required, and how far the worker has to reach to perform the lift. This equation returns a recommended weight limit (RWL) – the amount of weight that could be lifted that would keep the worker’s back safe during work. If you divide the actual weight being lifted by the RWL, you will get a value indicating the overall risk level of that given lift. If that value is greater than 1.0, this lift is above the RWL and puts the worker at a higher risk of injury.
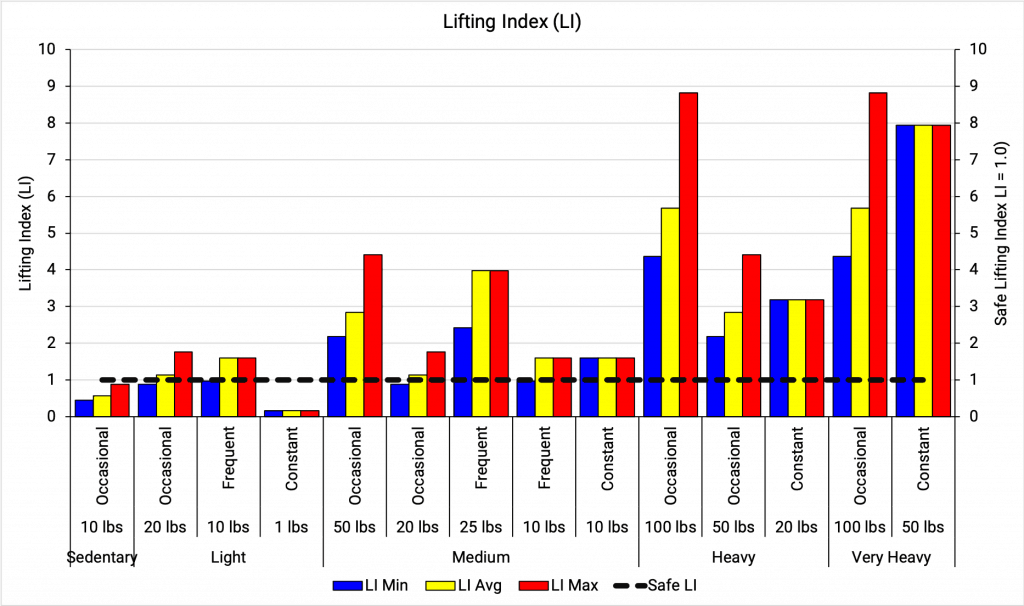
Looking at the DOL levels, and a simple lift from about knee height to waist height, I simulated what the RWL would be for the ranges of frequencies and lifting weights from the DOL strength levels (Figure 2). (For those who would like to replicate these calculations, the start height was 30 cm, travel distance was 45 cm, horizontal reach was 40 cm, there was no asymmetry, or coupling factors modification. For frequencies, I used the less than 1 hour factors, and V<30. Each lift was assumed to be 2 s in duration, and the corresponding FM factor was found).

Figure 2. Lifting Index for the minimum, average, and maximum frequency possible (in % of time) for each DOL strength level. Values of greater than 1 (above the black line), would be considered “unacceptable”, as they increase the risk of injury in the lifter.
According to the Lifting Index, and the NIOSH lifting equation, the vast majority of DOL levels for strength would be unacceptable and cause an elevated risk of injury for workers. In fact, no simulated task for the heavy or very heavy categories would be a safe lift, and only 2 of the 15 simulated lifts in the medium category would be safe lifts. What is very interesting, is these large ranges spanning the frequencies identified in the DOL strength levels, can produce a lifting index of as low as 0.87, and as high as 4.41, all within the same strength bin (in this case, Medium). That is a 507% increased risk of injury in one strength category – primarily because of the high force levels, and huge variety of frequencies defined in this methodology.
The NIOSH lifting equation examines risk during lifting as a factor of the amount of spine compression that is occurring. NIOSH recommends lifts should not exceed 3400 N of spine compression during lifting. The peak spine compression of a lift is an interesting variable to examine, but it doesn’t necessarily factor in frequency – which can be an important variable in assessing risk. Even without frequency, you can see the DOL levels and their corresponding peak spine compression levels (predicted using Potvin 1997’s method) often exceed what’s known to be safe (Figure 3).

Figure 3. Predicted spine compression level from different lifts, classified by the DOL levels of strength, compared to the NIOSH safe lifting limit of 3400 N.
DOL levels that feature 50 lbs or higher as the acceptable lift are in the high risk category. That means, these types of jobs are only appropriate for very strong individuals, if you want someone to work there with a low risk of injury. Even then, over the long term, these individuals are more likely to sustain a back injury in the workplace.
DOL Levels Do Not Include Other Physical Demands
What isn’t included in the DOL levels are the other physical demands that could lead to an increased risk of injury in these types of work, e.g. lifting at, or above, shoulder height; lifting with a flexed spine; or a poor point of contact for gripping significantly impact the risk of injury.
The Demand Score includes the physical demands included with strength, but also factors in reaching, gripping, handling, data entry, and many more (26 different physical demands), compares these demands against known ergonomic standards, and develops a score from 1 to 100, helping you better understand a job, and how it compares to other jobs within the same industry.
In summary – job descriptions and physical demands analyses are very nuanced and detailed things. Boiling them down into one of 5 categories over-simplifies the different factors in return to work and injury prevention, which can lead to either prolonged absences, or exposure to higher levels of injury risk than previously considered.
Author: Dr. Michael Sonne, VP Innovations and Research at MyAbilities. A leading occupational biomechanics researcher, with a history of developing technologies to automate ineffective processes in the ergonomics industry. In 2010, Mike developed the Rapid Office Strain Assessment – a method for conducting self-guided, office ergonomics assessments, resulting in a reduction of musculoskeletal injuries. Mike has developed global standards for muscle fatigue assessment in repetitive work, particularly in assembly lines. Mike is an adjunct professor at Brock University, and the University of Ontario Institute of Technology, and continues to publish in peer-reviewed journals.
References:
- Waters, T. R., Putz-Anderson, V., Garg, A., & Fine, L. J. (1993). Revised NIOSH equation for the design and evaluation of manual lifting tasks. Ergonomics, 36(7), 749-776
- Potvin, J. R. (1997). Use of NIOSH equation inputs to calculate lumbosacral compression forces. Ergonomics, 40(7), 691-707


